
Watch a strategy trade, bar by bar.
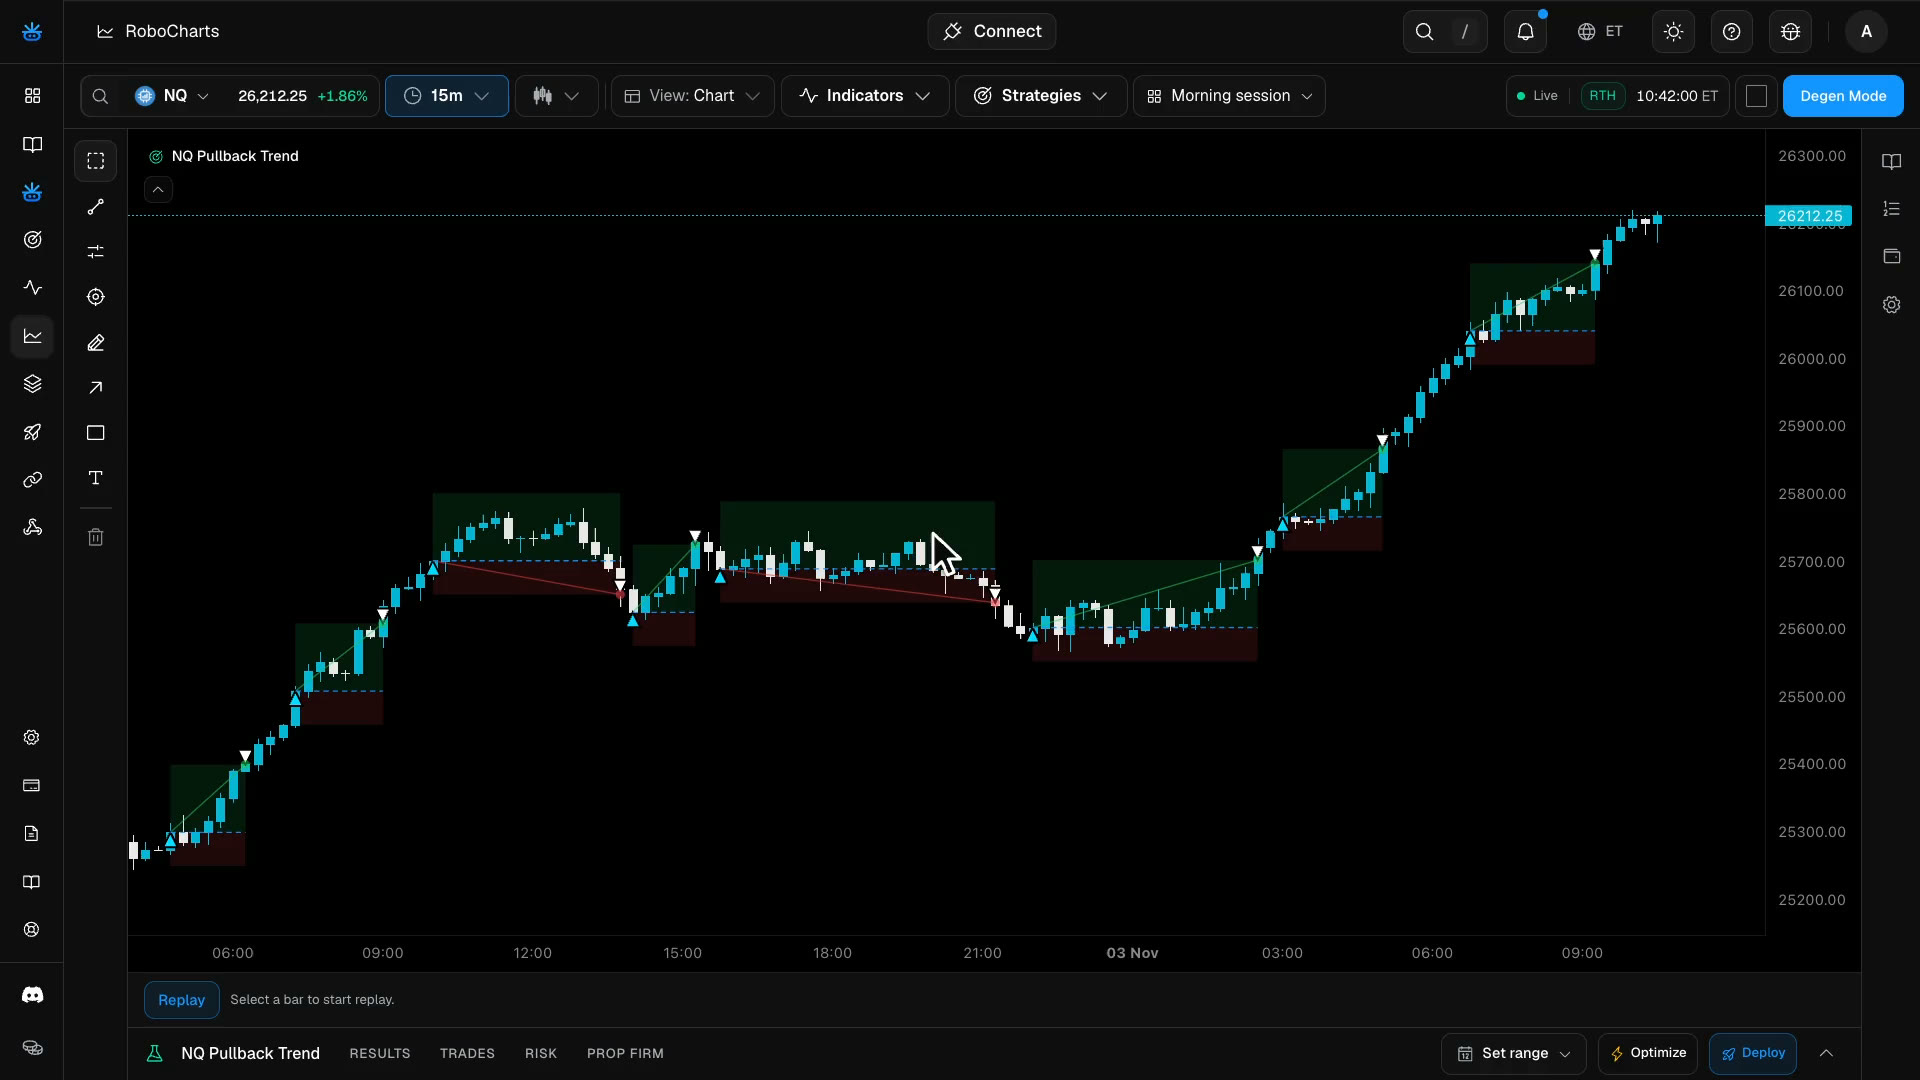
Bar-by-bar replay in RoboCharts, with trades, P&L and your bot’s drawings on the chart itself.
How it works
1
Open a strategy
Set up the backtest as usual.
2
Press Replay
Replay streams the run onto the chart while it computes.
3
Watch every decision
See entries, exits and drawings appear in order.
What you get
Bar by bar
Replay a strategy bar by bar on historical CME data.
Inline on the chart
Trades, P&L and your bot’s drawings sit on the chart.
Stops you can see
Follow stop and target rails and trailing-stop movement.
Real timing
A tick replay shows entries and exits at their real point inside the candle.
Indicators and logs
Your indicators and strategy logs stream with the run.
Speed is display only
Change the replay speed without changing the results.
By plan
| Feature | Free | Charts | Starter | Pro | Elite | Ultra |
|---|---|---|---|---|---|---|
| Interactive Replay | Preview | Preview | Included | Included | Included | Included |
| Multi-chart layouts | 2 charts | Up to 16 charts | Up to 16 charts | Up to 16 charts | Up to 16 charts | Up to 16 charts |
| Historical OHLCV | 1 year | 1 year | 3 years | 8 years | Up to 16 years | Maximum available |
| Historical trades/ticks | No | No | 3 years | 8 years | Up to 16 years | Maximum available |